I am interested in how within-host processes affect between-host disease transmission. This is summarised by the diagram below (adapted from Handel and Rohani 2015 Phil. Trans.). I’m working a bit on both (i) and (ii) in figure 1, and how they interact.

- Fig 1. A figure I slightly adapted from the great review by Handel and Rohani 2015 in Phil. Trans.
How within-host processes affect host infectiousness
I just presented a talk at the Virtual ASAB 2020 meeting on the latest work from the lab on this question. Here’s the video:
Less recently, I’ve used the guppy-gyrodactylid host-parasite system to show that within host processes affect host infectiousness. One main result of this work is that if a host has transmitted successfully before, it transmits more worms on its second attempt (figure 2a). Intriguingly, worms that transmit from an experienced ‘donor’ seem to be less fit than those from inexperienced donors (figure 2b). I’m not sure why this happens, but I’ll hopefully work it out at some point. It could mean that while ‘superspreaders’ (the infected hosts in a population that transmit infection to disproportionately large numbers of uninfected hosts) do infect more hosts, these infections aren’t as severe as those from ‘normal spreaders’.

- Fig 2. Panel (a) shows that donor guppies who had previously successfully transmitted an infection transmitted more parasites on their second attempt than donors on their first attempt. Panel (b) shows that the worm populations transmitted by these experienced donors had an equal probability of growing or shrinking (dashed line shows growth rate of 0), but those from inexperienced donors exclusively grew.
Another cool result from this experiment is that more resistant donors transmit more parasites – it’s as though the parasites are jumping ship from hosts that can effectively fight the infection (figure 3).
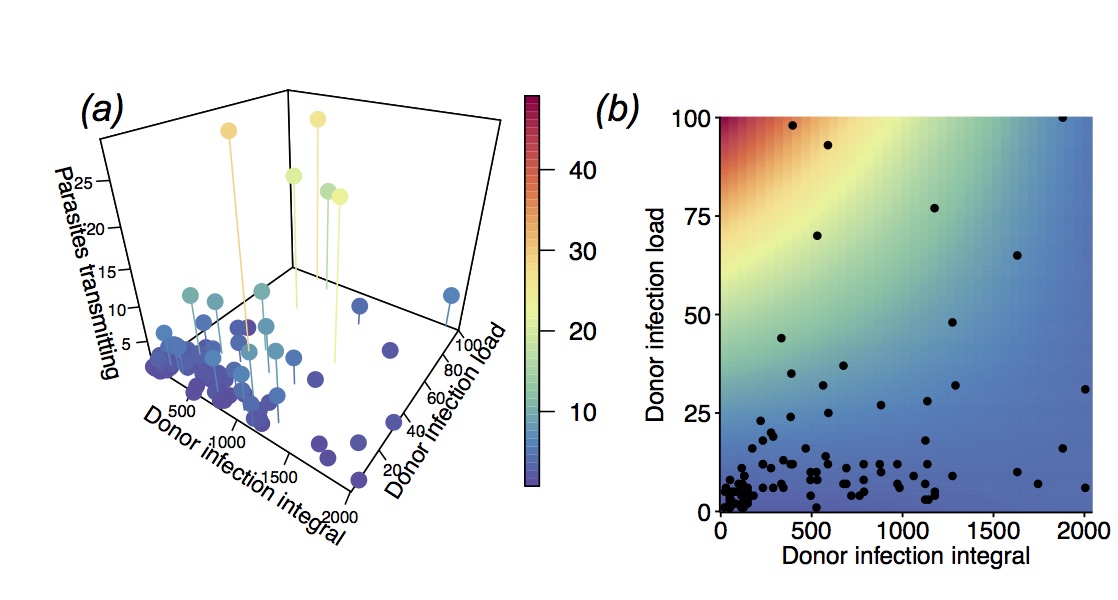
- Fig 3. In these plots, ‘donor infection load’ is the number of parasites on the donor at the point of transmission, ‘donor infection integral’ is a measure of resistance, and is the area under the curve of infection load over time. This means that donors that have large infection loads for long periods (i.e. they are unable to limit parasite growth) have the largest infection integral. Panel (a) shows the raw data – donors that transmitted the largest number of worms are those that had heavy infection loads, but low infection integral (so they were able to effectively fight the infection). Panel (b) shows the data laid over the predictions from a model. This clearly shows that the hosts with the largest infection integrals (i.e. those that can’t limit the infection at all) don’t really transmit many worms, regardless of how heavy their infection load is.
These results (and others) are in:
J. F. Stephenson, K. A. Young, J. Fox, J. Jokela, J. Cable, S. E. Perkins. 2017. Host heterogeneity affects both parasite transmission to and fitness on subsequent hosts. Philosophical Transactions of the Royal Society 372: 20160093.doi:10.1098/rstb.2016.0093 pdf.
How within-host processes affect the response infected hosts elicit from uninfected conspecifics
This is a bit of a mouthful, but basically I’m trying to work out how the healthy, uninfected individuals in a population may avoid their infected (and infectious) conspecifics. You’d think this would be a no-brainer, but actually, living in groups can be a good thing. Animals get better protection from predators, better foraging opportunities, better mating opportunities etc. etc. So leaving the group entirely because of the risk of becoming infected is a pretty bad option, probably almost as bad as actually being infected. In this paper, we found that guppies only avoid infected conspecifics that pose the biggest risk of transmitting the infection.
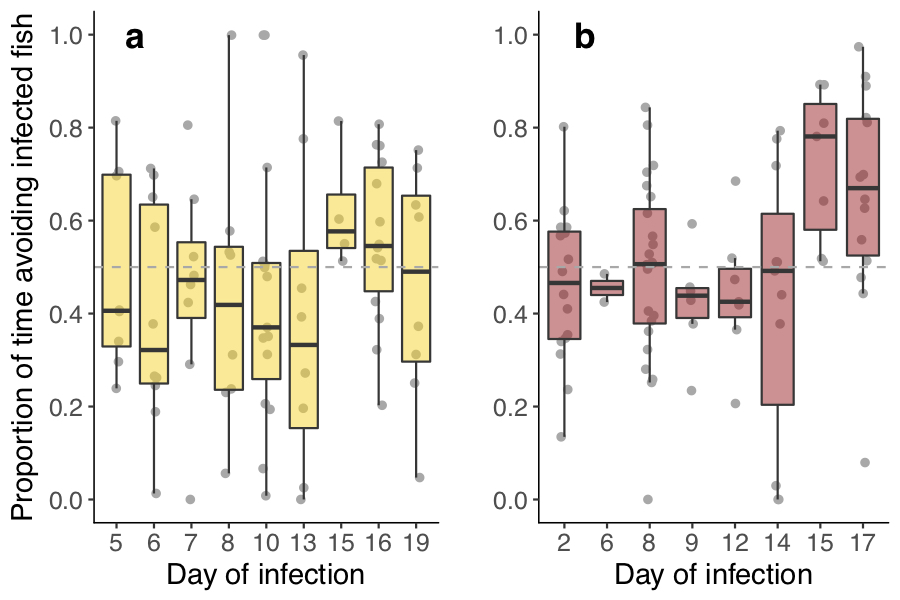
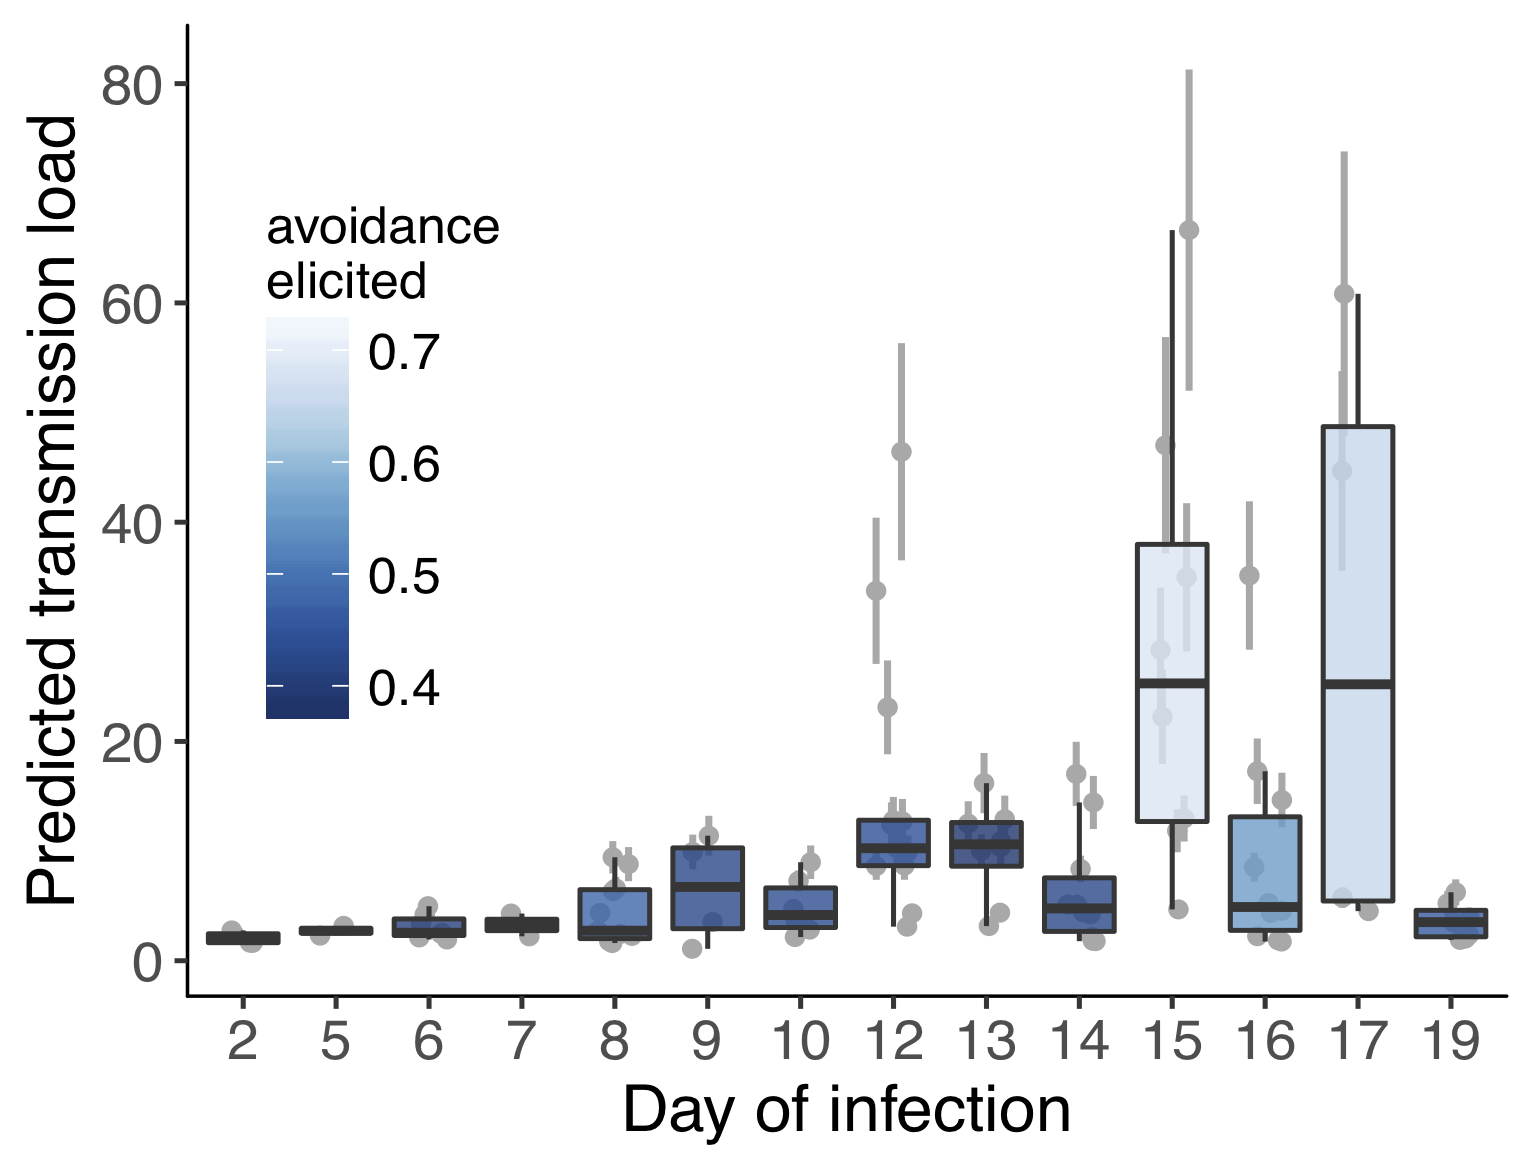
We first show data from the behavioural experiment, showing that uninfected fish DO avoid infected fish, but only when they’re in the later stages of infection and most likely to transmit the parasite (Fig. 4). I then used the data from the transmission experiment described above to see if these most strongly avoided fish would also be predicted to be the most likely to transmit the infection. When I finally got this R code to work and Fig. 5 popped up I almost fell off my chair – so excited!
If you want to know more, please read the paper:
J. F. Stephenson, S. E. Perkins, J. Cable. 2018. Transmission risk predicts avoidance of infectious conspecifics in Trinidadian guppies. Journal of Animal Ecology. 87: 1525-1533. doi:10.1111/1365-2656.12885pdf.
